The SAT Scoring Scale
An SAT score report includes a variety of scores. The score report will also include a percentile rank for each of these scores. Scores are generally available for online viewing within roughly one month after each test administration date.
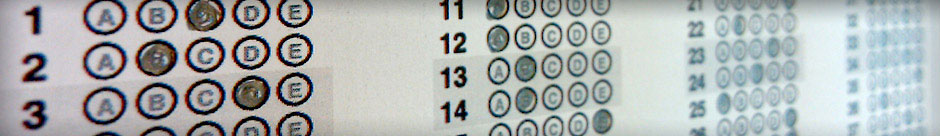
The first step in calculating a student’s scores on the SAT is to determine the raw score for each sections. Each correct answer adds 1 point to the raw score. The raw score for each section is then converted into scaled scores, as described below. The conversion process allows scorers to correct for minor variations in the difficulty of different test administrations so that the same level of ability should lead to the same scaled score on any test.
Some of the scores describe the same parts of the test in different ways or combinations.
Total Score
The total score is the best-known score for the SAT. Your total score can range from 400 to 1600 and will be based on the sum of your section scores.
Section Scores
You will receive two section scores:
- Evidence-Based Reading and Writing Score: 200-800
- Math Score: 200-800
The Evidence-Based Reading and Writing score is based on your performance in the first two sections of the test: (Section 1) Reading and (Section 2) Writing and Language.
The Math score is based on your performance in the last two sections of the test: (Section 3) math without calculator and (Section 4) math with calculator.
Test Scores
In additions to your total score and section scores, your score report will include three “test scores”:
- Reading Test Score (based on your performance in the Reading section of the SAT)
- Writing and Language Test Score (based on your performance in the Writing and Language section of the SAT)
- Math Test Score (based on your performance in the two Math sections of the SAT)
Each “test score” is reported on a scale of 10 to 40.
Subject-Based “Cross-Test” Scores
Throughout the SAT, some questions will be based on historical/social studies and some questions will be based on science contexts. Regardless of whether the question relied on your math, writing, language, or reading skills, the results of these questions will contribute to two “cross-test” scores:
- Analysis of History/Social Studies Score
- Analysis of Science Score
Subscores
In addition to the subject-based cross-test scores, your responses to certain questions contribute to seven subscores.
Responses to certain questions in the Reading section and the Writing and Language section will contribute to:
- Command of Evidence subscore
- Words in Context subscore
Responses to certain questions in the Writing and Language section will contribute to the following subscores:
- Expression of Ideas subscore
- Standard English Conventions subscore
Responses to certain questions on the Math sections will contribute to the following subscores:
- Heart of Algebra subscore
- Problem Solving and Data Analysis subscore
- Passport to Advanced Math subscore
Essay Score
If you take the SAT with Essay, you will also receive three scores for your essay:
- Reading score
- Analysis score
- Writing score
Each essay score is reported on a scale of 2 to 8. These three scores are not combined with each other or with scores from any other part of the test.
Percentile Scale
| Total Score | National Percentile | User Percentile |
| 1600 | 99+ | 99+ |
| 1590 | 99+ | 99+ |
| 1580 | 99+ | 99+ |
| 1570 | 99+ | 99+ |
| 1560 | 99+ | 99+ |
| 1550 | 99+ | 99 |
| 1540 | 99+ | 99 |
| 1530 | 99+ | 99 |
| 1520 | 99+ | 99 |
| 1510 | 99 | 98 |
| 1500 | 99 | 98 |
| 1490 | 99 | 98 |
| 1480 | 99 | 97 |
| 1470 | 99 | 97 |
| 1460 | 99 | 97 |
| 1450 | 98 | 96 |
| 1440 | 98 | 96 |
| 1430 | 98 | 95 |
| 1420 | 98 | 95 |
| 1410 | 97 | 94 |
| 1400 | 97 | 94 |
| 1390 | 96 | 93 |
| 1380 | 96 | 92 |
| 1370 | 96 | 92 |
| 1360 | 95 | 91 |
| 1350 | 94 | 90 |
| 1340 | 94 | 89 |
| 1330 | 93 | 89 |
| 1320 | 93 | 88 |
| 1310 | 92 | 87 |
| 1300 | 91 | 86 |
| 1290 | 90 | 85 |
| 1280 | 89 | 84 |
| 1270 | 88 | 83 |
| 1260 | 87 | 82 |
| 1250 | 86 | 81 |
| 1240 | 85 | 80 |
| 1230 | 84 | 78 |
| 1220 | 83 | 77 |
| 1210 | 82 | 76 |
| 1200 | 81 | 74 |
| 1190 | 80 | 73 |
| 1180 | 78 | 72 |
| 1170 | 77 | 70 |
| 1160 | 76 | 69 |
| 1150 | 74 | 67 |
| 1140 | 73 | 66 |
| 1130 | 71 | 64 |
| 1120 | 70 | 62 |
| 1110 | 69 | 61 |
| 1100 | 67 | 59 |
| 1090 | 65 | 57 |
| 1080 | 63 | 55 |
| 1070 | 61 | 54 |
| 1060 | 60 | 52 |
| 1050 | 58 | 50 |
| 1040 | 56 | 48 |
| 1030 | 54 | 46 |
| 1020 | 52 | 45 |
| 1010 | 50 | 43 |
| 1000 | 48 | 41 |
| 990 | 46 | 39 |
| 980 | 44 | 38 |
| 970 | 42 | 36 |
| 960 | 40 | 34 |
| 950 | 38 | 33 |
| 940 | 36 | 31 |
| 930 | 35 | 29 |
| 920 | 33 | 28 |
| 910 | 31 | 26 |
| 900 | 29 | 25 |
| 890 | 27 | 23 |
| 880 | 26 | 22 |
| 870 | 24 | 20 |
| 860 | 23 | 29 |
| 850 | 21 | 18 |
| 840 | 20 | 16 |
| 830 | 18 | 15 |
| 820 | 17 | 14 |
| 810 | 16 | 12 |
| 800 | 14 | 11 |
| 790 | 13 | 10 |
| 780 | 11 | 9 |
| 770 | 10 | 8 |
| 760 | 9 | 7 |
| 750 | 8 | 6 |
| 740 | 7 | 5 |
| 730 | 6 | 5 |
| 720 | 5 | 4 |
| 710 | 4 | 3 |
| 700 | 4 | 3 |
| 690 | 3 | 2 |
| 680 | 2 | 2 |
| 670 | 2 | 1 |
| 660 | 1 | 1 |
| 650 | 1 | 1 |
| 640 | 1 | 1 |
| 630 | 1 | 1- |
| 620 | 1- | 1- |
| 610 | 1- | 1- |
| 600 | 1- | 1- |
| 590 | 1- | 1- |
| 580 | 1- | 1- |
| 570 | 1- | 1- |
| 560 | 1- | 1- |
| 550 | 1- | 1- |
| 540 | 1- | 1- |
| 530 | 1- | 1- |
| 520 | 1- | 1- |
| 510 | 1- | 1- |
| 500 | 1- | 1- |
| 490 | 1- | 1- |
| 480 | 1- | 1- |
| 470 | 1- | 1- |
| 460 | 1- | 1- |
| 450 | 1- | 1- |
| 440 | 1- | 1- |
| 430 | 1- | 1- |
| 420 | 1- | 1- |
| 410 | 1- | 1- |
| 400 | 1- | 1- |
Percentile Section
| Section Score | Evidence National | Evidence User | Math National | Math User |
| 800 | 99+ | 99+ | 99+ | 99 |
| 790 | 99+ | 99+ | 99+ | 99 |
| 780 | 99+ | 99+ | 99 | 98 |
| 770 | 99+ | 99 | 99 | 97 |
| 760 | 99+ | 99 | 99 | 96 |
| 750 | 99 | 98 | 98 | 96 |
| 740 | 99 | 98 | 98 | 95 |
| 730 | 99 | 97 | 97 | 94 |
| 720 | 98 | 96 | 97 | 93 |
| 710 | 97 | 95 | 96 | 92 |
| 700 | 97 | 94 | 95 | 91 |
| 690 | 96 | 93 | 94 | 90 |
| 680 | 95 | 91 | 93 | 89 |
| 670 | 93 | 90 | 92 | 87 |
| 660 | 92 | 88 | 91 | 86 |
| 650 | 90 | 86 | 90 | 84 |
| 640 | 88 | 83 | 89 | 82 |
| 630 | 86 | 81 | 87 | 81 |
| 620 | 84 | 78 | 85 | 79 |
| 610 | 81 | 76 | 83 | 77 |
| 600 | 79 | 73 | 81 | 75 |
| 590 | 76 | 70 | 79 | 72 |
| 580 | 74 | 67 | 76 | 69 |
| 570 | 71 | 64 | 73 | 66 |
| 560 | 68 | 60 | 71 | 64 |
| 550 | 65 | 57 | 68 | 61 |
| 540 | 62 | 54 | 65 | 58 |
| 530 | 58 | 50 | 61 | 54 |
| 520 | 55 | 47 | 57 | 50 |
| 510 | 51 | 44 | 52 | 46 |
| 500 | 48 | 40 | 47 | 42 |
| 490 | 44 | 37 | 44 | 39 |
| 480 | 41 | 34 | 40 | 36 |
| 470 | 38 | 30 | 36 | 33 |
| 460 | 34 | 27 | 32 | 30 |
| 450 | 31 | 24 | 29 | 27 |
| 440 | 28 | 21 | 25 | 24 |
| 430 | 24 | 18 | 23 | 22 |
| 420 | 22 | 15 | 20 | 19 |
| 410 | 19 | 13 | 17 | 17 |
| 400 | 16 | 11 | 15 | 15 |
| 390 | 13 | 9 | 13 | 12 |
| 380 | 11 | 7 | 10 | 10 |
| 370 | 9 | 5 | 9 | 8 |
| 360 | 7 | 4 | 7 | 7 |
| 350 | 5 | 3 | 5 | 5 |
| 340 | 3 | 2 | 4 | 4 |
| 330 | 2 | 1 | 3 | 3 |
| 320 | 2 | 1 | 2 | 2 |
| 310 | 1 | 1 | 1 | 1 |
| 300 | 1 | 1- | 1 | 1 |
| 290 | 1- | 1- | 1- | 1 |
| 280 | 1- | 1- | 1- | 1- |
| 270 | 1- | 1- | 1- | 1- |
| 260 | 1- | 1- | 1- | 1- |
| 250 | 1- | 1- | 1- | 1- |
| 240 | 1- | 1- | 1- | 1- |
| 230 | 1- | 1- | 1- | 1- |
| 220 | 1- | 1- | 1- | 1- |
| 210 | 1- | 1- | 1- | 1- |
| 200 | 1- | 1- | 1- | 1- |